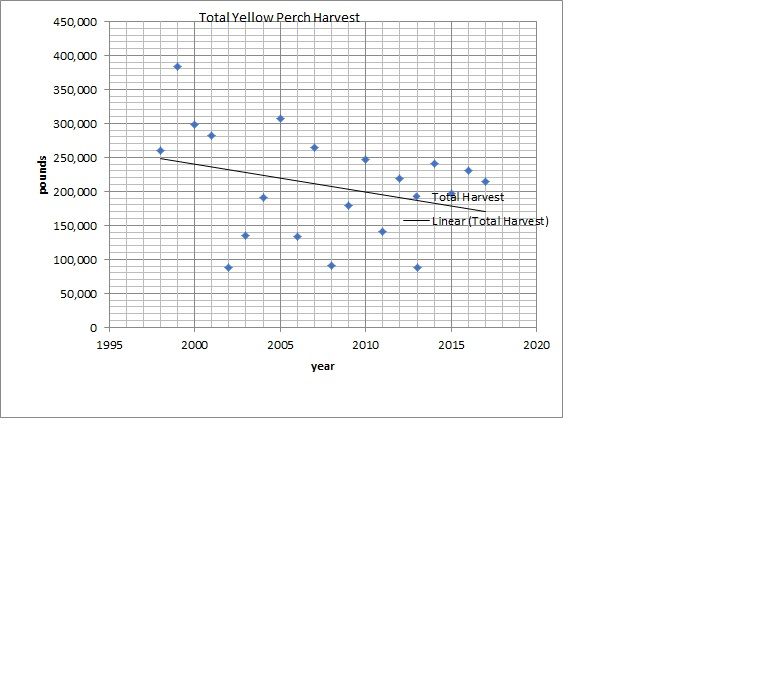
OK, so here's the same perch harvest data with the regression line plotted on it.
Sorry to those who thought the catch was hanging steady averaging around 200,000 ponds; it's not. The regression line is not as steep as the last time two years ago but still has a negative slope which means it's still going down. If this micro trends continues, however, the line could level out and I certainly hope that it does.
Also someone wrote that the numbers for 2017 would be way down because of some reasons but that dot over 2017 is already pretty high and it only includes the first 3 quarters; another 3 months of harvest will be added in once the fish mongers report it.
I'm not sure what happened to my previous post; it got taken down for some reason. I tried to explain the statistics but someone took offense.