The ice fishing VT boards are sponsored by:

Author Topic: Total Yellow Perch Harvest graph with regression line  (Read 966 times)

Offline jbritch

  • Team IceShanty Regular
  • ***
  • Posts: 273
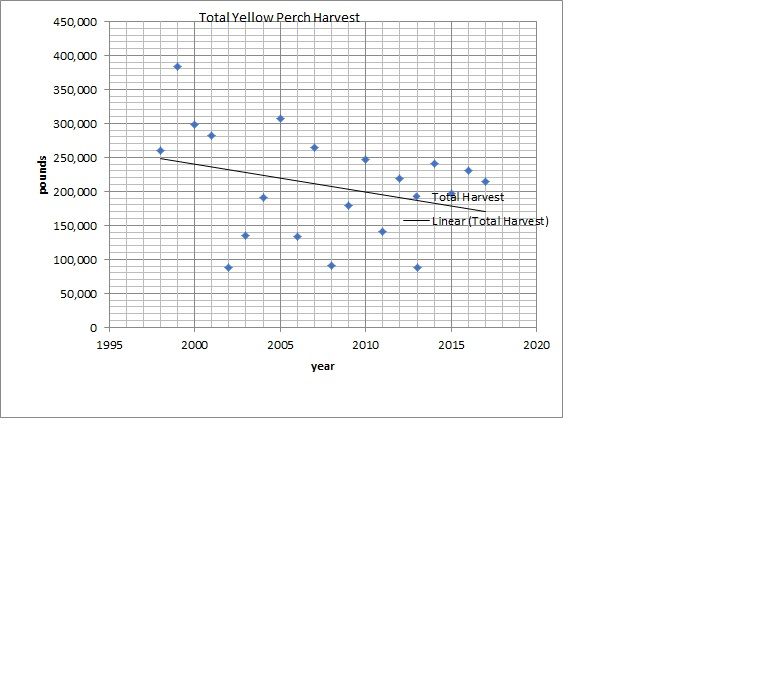
OK, so here's the same perch harvest data with the regression line plotted on it.

Sorry to those who thought the catch was hanging steady averaging around 200,000 ponds; it's not. The regression line is not as steep as the last time two years ago but still has a negative slope which means it's still going down.  If this micro trends continues, however, the line could level out and I certainly hope that it does.

Also someone wrote that the numbers for 2017 would be way down because of some reasons but that dot over 2017 is already pretty high and it only includes the first 3 quarters; another 3 months of harvest will be added in once the fish mongers report it.


I'm not sure what happened to my previous post; it got taken down for some reason.  I tried to explain the statistics but someone took offense. 


Offline thefishingweatherman

  • Team IceShanty Addict
  • *
  • Posts: 569
Re: Total Yellow Perch Harvest graph with regression line
« Reply #1 on: Mar 22, 2018, 08:16 AM »
If these are just raw catch numbers, the figures don't control for how many people are commercially fishing. Could be a similar trend to hunting, where there are downward trends.

Offline NHHARDWATER

  • Team IceShanty Addict
  • *
  • Posts: 572
  • -Aaron-
Re: Total Yellow Perch Harvest graph with regression line
« Reply #2 on: Mar 22, 2018, 08:19 AM »
This is really interesting data. Are there any records like this for the white perch harvest?
Thanks for sharing this JB!
Chasing Ice

Offline Champlain Islander

  • Team IceShanty Addict
  • *
  • Posts: 633
Re: Total Yellow Perch Harvest graph with regression line
« Reply #3 on: Mar 25, 2018, 06:25 AM »
I have been fishing Lake Champlain for many decades and can safely say there are far less people fishing now than 10 years ago. I am a frequent visitor to a popular fish shop and the perch harvest should show a decline this year due in part to many people deciding to not sell them. The low price pushed many to fish less and just fillet what they caught.
Taught ice fishing for pan fish by one of the best...Art Rye may he RIP

Offline Panfish hauler

  • IceShanty Rookie
  • **
  • Posts: 40
Re: Total Yellow Perch Harvest graph with regression line
« Reply #4 on: Mar 28, 2018, 01:07 PM »
  If you did one of these charts for lake Ontario or Lake Erie you would find that Yellow Perch numbers go up and down all the time due to good spawn years and bad spawn years.

 I would like to see a Graph on the increase of Double Crested Cormorants over the past 30 years and the poundage of Panfish they eat every year then everyone would see what the real problem is.

Offline ice fiend

  • Team IceShanty Addict
  • *
  • Posts: 780
  • im a die hard ice fishing addict 'nuff said
Re: Total Yellow Perch Harvest graph with regression line
« Reply #5 on: Mar 28, 2018, 03:52 PM »
Agreed also the amount of phosphorus in the lake as a result of poorly managed farm waste run off I’d like to see that as well
i told myself id be back by 2 i guess i didnt factor in that the fish were biting


Iceshanty | MyFishFinder | MyHuntingForum
Contact | Disclaimer | Privacypolicy | Sponsor
© 1996- Iceshanty.com
All Rights Reserved.